Showing posts with label Closed-End Schemes. Show all posts

April 14, 2019

Thoughts On The FMP Fiasco

This is only my second post in the last nine months, and while I’d like to believe that there hasn’t been much to write about all this while, the truth is that ongoing priorities have kept me away, not just from writing, but from closely tracking the fund industry as well.  Still, thanks to the evolving FMP crisis (which I couldn’t ignore) and the incessant cajoling of my collaborators, for whatever it is worth, here it is. 

Anyone who has been following the coverage of the crisis in the media (mainstream and social), would have noted that much of the attention has been on Kotak MF, and on the so-called “safety” of FMPs.  In this post, I’d like to move that spotlight a bit.  The way I see it, firstly, the risks in investing in FMPs are, more or less, the same as they have been over the last several years.  It’s just that many investors, advisors, and fund houses, have been in denial over the fact that portfolio concentration is a bigger risk than credit quality in itself.  While I’ve talked at length about this previously, in this post, I want to talk about the questionable choices made by fund houses this time around, once this risk became a likely reality.  Secondly, I feel that looking at the FMP fiasco from the lens of the decisions of HDFC MF (rather than Kotak MF) offers a better picture of what has happened.  Investors in Kotak FMPs may have been the first to be visibly impacted, but it was HDFC MF that was the first to make the choices that brought us to where we are.

Let me start by flipping back to a month ago.  By my count, there were 6 NCDs issued by three Essel group companies that were due to mature in March.   HDFC MF had investments in two of these companies (across 5 NCDs).  Most of these investments were held in FMP portfolios.  These are the details of those NCDs:

Name of company ISIN Date of Maturity
Edisons Utility Works Pvt. Ltd.^INE097P0704722 March 2019
INE097P0706222 March 2019
INE097P0709620 March 2019
Sprit Textiles Pvt. Ltd.#INE069R0709122 March 2019
INE069R0710920 March 2019

^ Since renamed as Edisons Infrapower & Multiventures Pvt. Ltd.
# Since renamed as Sprit Infrapower & Multiventures Pvt. Ltd.
NCDs whose ISIN is shaded are zero coupon bonds


As you will note from the table, all of these NCDs were slated to mature between 20-22 March 2019.  The reason I mention this is because, in the portfolio disclosure made by HDFC MF, all of these investments were shown to be held in the portfolios of its schemes as on 31 March 2019, more than a week after they were supposed to have matured.  It begs the question- what happened?  If the fund house got back its money on the date of maturity, then why were these investments shown in the scheme books as on 31 March?  And if the fund house didn’t get back its money, shouldn’t these investments have been written off? 

When I first saw the portfolios, I couldn’t figure out what exactly had happened.  Since then, it has come to light that the maturity date of these investments was “revised” to 30 September 2019.  But how did something like that come about?  Surely, an issuer can’t unilaterally revise the date of maturity.  Was this the outcome of the much talked about agreement between the lenders and the Essel group back in January? 

Regardless, in my opinion, there can be no excuse for treating non-payment on the original due date as anything but a default.  What I find especially remarkable is that three of the NCDs above were zero coupon bonds and accounted for over 61% of the value of these NCDs.  To put it differently, these are investments on which the fund house would not have received a single rupee of interest or principal over the last 3 years or so. 

It appears that Kotak MF took a similar stance as HDFC MF in respect of the NCDs it held (which matured on 8 April).  In its case, it appears that all the NCDs that matured were zero coupon bonds.  Personally, I believe that all these investments should have been written off completely.

But coming back to the revision of maturity date, there are two other aspects about this that bother me.  The first relates to investment norms for FMPs.  As per SEBI regulations, a FMP can invest only into securities which mature before the date of maturity of the scheme.  Of the 8 HDFC FMPs that held the aforesaid NCDs, one is maturing on 30 September (i.e. on the revised maturity date).  All the other FMPs (including one that has been decided to be rolled over) were/ are maturing not later than 1 July 2019.  Going by that, revising the maturity date would appear to be in violation of the SEBI MF regulations.

The second issue that bothers me is the role of the rating agency.  In December, last year, the rating agency had put the abovementioned companies/ NCDs on “credit rating watch”.  On 31 January, soon after the debacle related to the sale of shares of ZEEL, the rating agency put out a note, stating that the rating remained unchanged.  What puzzled me about that note was that the rating agency seemed to base its view more on the stated intent of the lenders and the borrowers, than anything else.  Importantly, there was no mention of any change in the date of maturity of the NCDs.

Then on 18 February, it downgraded the ratings by one notch to A, while maintaining the “credit rating watch”.  But there was still no mention of the maturity of the NCDs being revised.  Its next communication was only on 10 April i.e. three weeks after the original maturity date of these NCDs had passed.  It was here that it noted the revised maturity date of the NCDs.  From what I could gather, and strangely to me, the rating agency didn’t seem to see this as an issue of any significance.  Personally, I think there was a good case for the rating to be downgraded to D.

Looking at this all together, throws up a number of questions.  Why did the fund houses not mark down these investments?   Was it a coincidence that both Kotak MF and HDFC MF decided the same course of action?  Was it a coincidence that the rating agency took a similar view?  Or that the rating agency put out its note only after the NCDs held by Kotak MF had matured? 

One industry insider, whom I spoke to, offered this explanation for the action of the fund houses: “It’s all about the NAV.  They can’t risk showing a low NAV.”  That may well be, and there may be other reasons as well.  One thing appears certain to me: both these fund houses (and perhaps others as well) appear to be desperate to project an illusion of safety around FMPs.  What is worse is that these fund houses are attempting to manipulate investors by playing on their behavioural biases. 

Take for instance, the decision by HDFC MF to roll over one of its FMPs.  Like some others, I hold the view that the officially stated purpose behind doing so, is a preposterous and sanctimonious assertion meant to camouflage the fact that the scheme has ~20% of its portfolio in Essel group companies.  But in terms of their relationship with investors, the roll over strikes me as a way to delude the investors into believing that they never risked losing money. 

Similarly, I noted a very careful choice of words by one of the spokespersons of Kotak MF, which also struck me as intended to delude investors.  To paraphrase the comment: “The impact is primarily on the returns, not on principal”.  To which I am tempted to retort: “Have you ever heard of time value of money?”  Even more bizarre was another statement by that person: “I tend to disagree that it is a call gone wrong”.

For anyone still wondering about what the fund houses were thinking, I present this (hopefully accurate) observation from the latest HDFC MF and Kotak MF portfolio disclosures.  While most of the NCDs of Essel group companies were held in FMP portfolios, there were only two open-end debt funds that also held these NCDs.  These were HDFC Credit Risk Debt Fund and Kotak Credit Risk Fund.  Need I say anything more?

February 27, 2018

Far-Fetched Alpha Projections

Imagine that a fund house launches a new, actively managed, diversified equity scheme.  Now imagine that in its presentation material it says something to the effect that if this scheme had been launched several years ago, then this is the return that that scheme would have given, and this is the alpha that the scheme would have generated.  Without a doubt, that’s a really big ‘if’.  My question, then, is this: is it proper for any fund house to make such an assertion? 

In case you are wondering, this is not a hypothetical question.  Over the last weekend, I actually came across some presentation slides for a newly launched closed-end equity scheme, in which such projections were made.  And it wasn’t just the returns: the fund house had made projections regarding the scheme’s standard deviation and index correlations.  According to the fund house, these numbers were derived from a “portfolio simulated with the investment process and strategy proposed for the scheme”.  To tell you the truth, I don’t know if SEBI allows fund houses to make counterfactual projections and, if so, in what circumstances.  Personally, though, regardless of disclaimers, I question the wisdom of doing so. 

But even if I were to give this fund house the benefit of the doubt, there is still the question of how accurate are the numbers that they projected.   According to the fund house, if the scheme had existed six years ago, then from 2012 to 2017, it would have generated an alpha (outperformance) of ~6% p.a. over the Nifty 50 TRI.

Right off the bat, that struck me as problematic. And it all had to with the period selected.  Rather than take a single period of 6 years, a much more fairer way would have been to consider rolling periods.  Given that the new scheme has a maturity of just over 3 years, it would have been appropriate to consider the rolling 3 year alpha.  But probably the biggest issue I have is with the difference in market valuations.  At the start of the period chosen by the fund house, the PE ratio of the Nifty 50 was 16.75.  In contrast, at the current point in time, which is when the scheme is being launched, the PE ratio of the Nifty 50 is over 25 (despite the recent fall in the markets).  For those who may wonder why that should make a difference, let me explain.

As most of us would know, there is a strong inverse correlation between medium-term equity scheme returns and the market valuations at the time of investing.  In simple terms, at the time of investing, the higher the PE ratio of the Nifty 50 (or BSE Sensex), the lower are the chances of getting above-average returns over a period of 3-5 years.  I would like to suggest that there is a similar relationship between market valuations and fund manager alpha.  To put it again in simple terms, the higher the PE ratio of the Nifty 50, the lower are the chances of a fund manager generating above-average alpha over a period of 3-5 years.  For those of us who like hard data, the table below might give a sense of the impact of market valuations on fund manager alpha over a 3 year period.

Rolling 3 Year Alpha Of Diversified Equity Schemes: 2000-2017

PE Ratio
at start
% Instances
Alpha > 0
% Instances
Alpha > 6%
Average
Alpha
Below 18 86% 49% 8.1%
18 - 22 84% 14% 3.1%
Above 22 45%3%-0.6%
Overall 80%28%4.9%

The table considers all possible 3 year investment periods between 30 March 2000 and 29 Dec 2017 which have been grouped based on the PE ratio of the Nifty 50 at the start of each period.  Alpha is calculated by subtracting the CAGR of the Nifty 50 TRI from the CAGR of the CRISIL-AMFI Diversified Equity Fund Performance Index.  Total no. of observations: 3591.  No. of instances of PE ratio below 18: 1602, PE ratio between 18 and 22: 1555, PE ratio above 22: 434.
Data/ Information sources: CRISIL, IISL, NSE

As you would notice in the above table, while diversified equity funds, put together, have overall generated positive alpha 80% of the time, in periods where the PE ratio of the Nifty 50 was over 22 (at the start), they have generated positive alpha only 45% of the time.  Similarly, while these funds have overall generated an average outperformance of 4.9% p.a., in periods where the PE ratio of the Nifty 50 was over 22 (at the start), on an average, they have generated negative alpha.

But coming back to the fund house in question, what of its own track record of generating alpha?

As it happens, the fund house has three open-end equity schemes that are somewhat comparable with the new scheme, on account of having the same benchmark.  The table below shows the rolling 3 year alpha generated by an equal-weighted buy-and-hold portfolio of these three schemes since 2007 (the time from which all three schemes have been in existence).

Rolling 3 Year Alpha Of Existing Comparable Schemes: 2007-2017

PE Ratio
at start
% Instances
Alpha > 0
% Instances
Alpha > 6%
Average
Alpha
Below 18 100% 44% 5.9%
18 - 22 86% 36% 4.4%
Above 22 48% 5% 0.2%
Overall 82%32%4.0%

The table considers all possible 3 year investment periods between 7 June 2007 and 29 Dec 2017 which have been grouped based on the PE ratio of the Nifty 50 at the start of each period.  Alpha is calculated by subtracting the CAGR of the Nifty 50 TRI from the CAGR of an equal-weighted buy-and-hold portfolio of the three existing schemes managed by the referenced fund house that are most comparable to the new scheme being launched.  Total no. of observations: 1859.  No. of instances of PE ratio below 18: 501, PE ratio between 18 and 22: 984, PE ratio above 22: 374.
Data/ Information sources: NJ India Invest, IISL, NSE

As you would notice, the existing schemes of the fund house have, on an average, generated an outperformance of 6% p.a. or more, only about 32% of the time.  And in periods where the PE ratio of the Nifty 50 was over 22 (at the start), they have generated such an outperformance only 5% of the time.  Furthermore, the average outperformance of these schemes in periods where the PE ratio of the Nifty 50 was over 22 (at the start), was just 0.2% p.a.

In a nutshell: the fund house’s assertion of generating outperformance of ~6% p.a. over the Nifty 50 TRI is exaggerated and misleading. 

December 31, 2017

The Murky Inconsistencies Of Axis Hybrid Fund

From 2011 onwards, Axis MF has launched a series of 3-4 year closed-end, income schemes with marginal equity exposure (like a MIP) under the common name of Axis Hybrid Fund.  At its peak, the AUM under these schemes was ~7600 crore.  The current AUM of the outstanding schemes is estimated to be around 5800 crore.  Despite the considerable AUM of these schemes, there is very little awareness about their portfolios and performance. 

These schemes first came to my attention, a few months ago.  Since then, I have had the opportunity to look at them closely, and have found a lot that is questionable and disturbing.  In this post, I’d like to shed light on some of the issues that I have seen.  For the record, I sent an email to the fund house, raising the points in this post, but received no acknowledgment or response from them.

Active or Passive?
Each scheme under the Axis Hybrid Fund series has been/ is passively managed.  The annual reports confirm this.  The approach has been to manage the debt portion of each scheme like a FMP, and to allocate the equity portion to Nifty Call Options that are held till their expiry.  The problem is that, going by the Scheme Information Documents (SID), it would seem that the equity portion is supposed to be actively managed.  Consider this extract from the SID of the first scheme in the series:

For the equity portion, the focus would be to build a diversified portfolio of strong growth companies, reflecting our most attractive investment ideas, at all points of time.  The portfolios will be built utilizing a bottom-up stock selection process, focusing on appreciation potential of individual stocks from a fundamental perspective.

From the fourth scheme onwards, the text was slightly modified to include a caveat “to the extent the fund invests in equity shares”.  Nevertheless, the SIDs have continued to mislead by unambiguously stating that the schemes “will invest in a diversified portfolio of Equities & Equity Related Instruments (including options premium) across market capitalisation.”

But that isn't all.  Three of the schemes in the series were rolled over on maturity, for another 3-4 years.  Ever since then, they have stopped holding any equities in their portfolios: shares or derivatives.  That’s despite the fact that the indicative asset allocation provides for the schemes to have 5%-30% of their portfolios in equities “under normal circumstances”.  All other schemes continue to hold the Nifty call options.

There is a bigger question, though, that lingers in my mind: in a closed-end fund (especially one with a 3-4 year maturity), does buying and holding an index (or index call options) really constitute an investment strategy?  As it happens, one portfolio manager whom I spoke to, had this to say: “That is hardly a strategy.  That is speculation.”

Excessive Expense Ratios
Generally speaking, the norm is for passively managed funds to have lower expense ratios than similar, actively managed funds, and for income funds to have lower expense ratios than equity funds.  FMPs usually have the lowest expense ratios among income funds, and that’s mostly true for Axis MF’s FMPs (Axis Fixed Term Plan).  Since 70%-95% of the portfolio of any Axis Hybrid Fund is managed as a FMP, these schemes should logically have expense ratios that are only slightly higher than the FMPs launched by the fund house.  Quite to the contrary, the actual difference between the two is glaring.

Average Expense Ratios: FY 17
Regular Plans Direct Plans
Axis Fixed Term Plan series 0.50% 0.07%
Axis Hybrid Fund series 2.53% 1.34%

Data source: Abridged Annual Report 2016-17

For those who can do the maths, if you assume that, on an average, 80% of the portfolio of each Axis Hybrid Fund scheme was managed as a FMP, and apply the average expense ratio of Axis Fixed Term Plan series to that portion, you will conclude that for the passively managed Nifty call options, the investors in regular plans were charged 10.6% of the equity AUM as expenses.  Think about that for a moment.  Is there any measure by which such a number can be justified?

There’s one other thing that disturbs me.  You may remember those three schemes I mentioned above which were rolled over and which no longer hold any equities.  Those roll-overs happened between Jan-March 2017.  Well, despite being now managed exactly like FMPs, their average expense ratio in the first 6 months of the current financial year was 2.84% (source: unaudited half yearly financials, Sep 2017).

I suspect that the Axis Hybrid Fund series are among the most expensive passively managed mutual fund schemes in the world.

Questionable Performances
All the schemes in the series are benchmarked against the CRISIL MIP Blended Index.  On account of the exposure to derivatives (which increases volatility), it is best to compare performance only across the complete tenure of a scheme.  Even so, the results vary significantly.  While the first three schemes in the series each outperformed the benchmark by an average of 2.1% p.a., the next eight schemes each underperformed the benchmark by an average of 4.2% p.a.  By any standard, that’s an astonishing level of underperformance, even after considering the excessive expensive ratios of the schemes.  Not only that, each of these eight schemes underperformed their own liquid fund (Axis Liquid Fund) by an average of 1.2% p.a.  The table below gives the relative returns of each of the schemes in the series that have matured.

Return p.a.
Scheme Benchmark
Axis Hybrid Fund - Series 1 11.2% 9.4%
Axis Hybrid Fund - Series 2 11.6% 9.4%
Axis Hybrid Fund - Series 312.0% 9.7%
Axis Hybrid Fund - Series 5* 6.2% 11.3%
Axis Hybrid Fund - Series 6* 7.1% 12.0%
Axis Hybrid Fund - Series 7* 7.2% 11.3%
Axis Hybrid Fund - Series 8 7.7% 11.8%
Axis Hybrid Fund - Series 9 7.7% 12.1%
Axis Hybrid Fund - Series 11 6.6% 10.9%
Axis Hybrid Fund - Series 12 6.6% 10.3%
Axis Hybrid Fund - Series 13 6.4% 9.7%

Returns are for regular plans and for the entire tenure of each scheme
* Axis Hybrid Fund - Series 5, 6 & 7 were rolled over and their returns are for their original tenure
Data/ Information sources: Axis MF, CRISIL, NJ India Invest, Value Research

What makes those numbers even more awful is the volatility that accompanied the returns.  I would like to particularly mention Axis Hybrid Fund – Series 5 which, apart from giving the lowest return, had, at one point, a level of volatility that rivalled that of equity funds.  As evidence, consider the chart below which covers the first six months of the scheme.

Axis Hybrid Fund - Series 5 NAV

On the basis of the chart above, one could be mislead into thinking that this was an equity scheme rather than an income scheme.

All of this leads to an obvious question: why would anyone have invested in any of these schemes?

It would seem that these schemes were mostly ‘sold’ rather than ‘bought’, if you get what I mean.  Going by the latest disclosures, 99.7% of the AUM came through distributors.  Probably most tellingly, over 92% came through associate distributors of Axis MF (presumably, Axis Bank).  I can only imagine what kind of conversations they had with their clients.

December 25, 2017

In The World Of ‘Yo-Yo Funds’

On the fringes of the more volatile mutual fund schemes, there lie a set of schemes that I am tempted to describe as ‘yo-yo funds’.  Why?  Because of the way that their NAVs swing up and down, like a yo-yo.  All too often, their NAVs rise sharply one day, and then fall sharply the next day, or vice versa.  Thus far, all such schemes that I have seen are closed-end equity/ hybrid schemes, and a  key common link to their NAV fluctuations is their exposure to long-term derivatives contracts.  In this post, I propose to shine a bit of light on these schemes.  In doing so, there are three things that I hope to accomplish.

The first is to create awareness about the existence of ‘yo-yo funds’.  In conversations that I have had with advisors and investors, most of the people that I spoke to, could not believe that the NAV of any mutual fund scheme could fluctuate in such a way.  The second is to caution those considering investing in closed-end equity and hybrid schemes that are likely to have exposure to long-term derivatives contracts.   Such NAV fluctuations are something that they could well encounter, and they should be willing to accept that.  The third is to reinforce the point on volatility which was the heart of my last post.  I believe that fund houses need to be more sensitive to the impact that volatility can have on investors, even in closed-end schemes.

To keep things simple, I’ll focus on two such schemes. I’ll present some numbers on their NAV fluctuations, as also the visual evidence of charts.  Both are 3-4 year closed-end equity schemes, but with different benchmarks, and managed by different fund houses.  Both schemes were launched in July 2017.  To be clear, my choice of these schemes is not related to what I feel about their fund houses.  These are good examples that can help in reflecting upon the problematic existence of ‘yo-yo funds’.

HDFC Equity Opportunities Fund-II-1100D June 2017

Benchmark: Nifty 50
Launch Date: 12 July 2017
Maturity Date: 20 July 2020

The chart below shows the NAV movements of the scheme since its inception.  It also gives a sense of the frequent swings that made me regard this as a ‘yo-yo fund’.  It may be instructive to compare those swings with the movement in the value of the benchmark at those times.

HDFC EOF II 1100D June 2017 NAV

The table below summarizes the extent of daily fluctuations in the NAV of the scheme, relative to its benchmark index. 

Fund Benchmark
Max rise on a single day 4.2% 1.2%
Max fall on a single day -4.3% -1.6%
Standard Deviation (daily returns) 36.5% 11.8%
% of days on which swing in excess of +/- 3% 23% Nil
% of days on which swing in excess of +/- 4% 5%
Nil

Data period: 17 July 2017 to 15 Dec 2017
Data/ information sources: HDFC MF, NJ India Invest, NSE, Value Research


ABSL Resurgent India Fund – Series 4

Benchmark: S&P BSE 200
Launch Date: 7 July 2017
Maturity Date: 6 June 2021

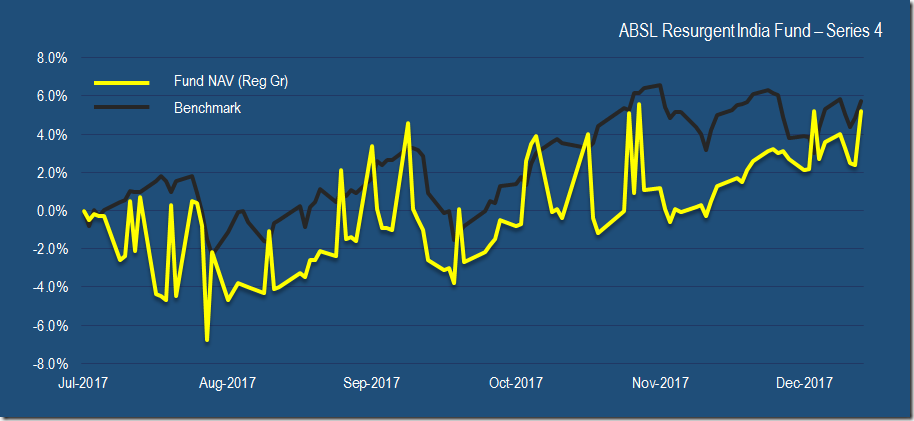
As with the previous scheme, the chart below shows the NAV movements of this scheme since its inception.  You may notice that the NAV swings in the case of this scheme (relative to the previous scheme) are much more pronounced.  This is also borne out by the data in the table below the chart.

ABSL Resurgent India Fund - Series 4 NAV

Fund Benchmark
Max rise on a single day 5.7% 1.3%
Max fall on a single day -6.0% -1.9%
Standard Deviation (daily returns) 44.5% 12.6%
% of days on which swing in excess of +/- 3% 23% Nil
% of days on which swing in excess of +/- 4% 16%
Nil

Data period: 17 July 2017 to 15 Dec 2017
Data/ Information sources: ABSL MF, Asia Index, Value Research

Both these schemes hold Nifty put options, evidently for the purpose of hedging.  There are some who argue that such hedging is necessary to protect investors in the schemes, and that the volatility should be seen in that context.  There are others who suggest that the volatility is mostly on account of the lack of depth in the derivatives market, and that it is unfair to blame fund houses for that.  To me, though, these arguments overlook/ bypass a more fundamental question: what is the compulsion to launch closed-end equity schemes, particularly those with maturities of 3-4 years?

⬅ Previous