Showing posts with label HDFC. Show all posts

September 29, 2021

BAF- Balanced Advantage Fakery

A first-time investor in Indian funds, who recently relocated from the US, reached out to me with this question: “How is a ‘balanced advantage fund’ different from a dynamic asset allocation fund?”    He expanded on that saying that until recently, he thought they were one and the same- that a ‘balanced advantage fund’ was just a desi term (his words) for a dynamic asset allocation fund.  But now, after reading something, he wasn’t so sure.

The term ‘balanced advantage funds’- if I can actually call it a term- did indeed evolve as a sort of an Indianism for tactical (or dynamic) asset allocation funds after a number of such funds, one by one, adopted the words ‘balanced advantage’ as part of their name.  In part, one could attribute that to a 2017 circular from SEBI in which it drew up most of the scheme categories as they exist today.

Unfortunately, some fund houses have reduced its use to a marketing ploy.  There is at least one fund house that uses this term as a masquerade (more on that later).  Lastly, there are individuals, including journalists, who use it out of ignorance and/ or indifference.  In my experience, this lack of authentic communication has ended up confusing and misleading many investors.  I suspected that something on those lines had happened with this investor as well.  It turned out to be worse than I thought.

The investor had read a recent interview of a senior executive at one of the largest fund houses in which he made this bizarre assertion:

…as per SEBI, we can either have dynamic asset allocation or balanced advantage fund.

With all the politeness and political correctness that I could muster, I explained to the investor that what the executive had said, was utter nonsense.  As evidence, I shared with the investor, copies of the SIDs of a few schemes, all of which had the words ‘Balanced Advantage’ in their names.  This included a scheme that is managed by the fund house where the aforementioned executive is employed.  In all these SIDs, as statutorily required, the ‘type of scheme’ is mentioned as ‘dynamic asset allocation fund’.

I further pointed out to the investor that any fund with the words ‘Balanced Advantage’ in its name could have just as well had the words ‘Dynamic Asset Allocation’ in its name, and vice versa.  In fact, a dynamic asset allocation fund can be called anything else, if SEBI is willing to go along with that.  Thus, we have a few funds that prefer ‘Dynamic Equity’ in their name, and one that goes by the name of ‘Equity Debt Rebalancer’.

It seemed as if I had got across to the investor, but he had one more related question.  Why was it that in India he could find no ‘balanced’ funds, and only ‘balanced advantage’ funds?

It’s a great question, if you ask me.  To this, I would add a few more. 

  • Why did SEBI emphatically limit the use of the word ‘balanced’ in fund names but saw no issue with the term ‘balanced advantage’? 
  • Why has SEBI allowed HDFC Balanced Advantage Fund to be called as such, and categorized as it is, when it is indisputably managed as an ‘equity hybrid’ fund?  
  • How is it that the SID of HDFC Balanced Advantage Fund mentions its scheme type as ‘balanced advantage fund’, which is in violation of SEBI’s 2017 circular? 
  • Who should be held responsible for investors making poor choices in selecting a dynamic asset allocation fund, just because they aren’t privy to any of this?

To be clear, I support SEBI’s efforts in curtailing the use of misleading terminology.  However, issues and anomalies such as the ones I have pointed out, hurt SEBI’s credibility and undermine its efforts in that direction.

Dynamic asset allocation funds have the potential to do more good for lay investors than any other category.  But I think it’s worth remembering that this is also one of the most challenging categories to select a fund from, and to monitor. 

As with most hybrid funds, these funds need close scrutiny because, by and large, there are no restrictions on where the equity portfolio will be invested or how the debt portfolio will be managed.  In addition, investors need to be clear about how each fund proposes to make its tactical shifts, the limits to that, and the rationale behind that.  Investors also need to keep track of how each fund’s allocation is split between unhedged equity, hedged equity, and debt instruments. 

At the very least, fund houses should refrain from playing devious name games with investors.

July 18, 2020

A Questionable Rollover

HDFC MF recently decided to roll over, for a period of 18 months, the two closed-end equity schemes under its HDFC Equity Opportunities Fund- Series II.  The first of these schemes has been rolled over while the second is due to be rolled over a few days from now.  While rollovers are not unheard of, I question the reasons for doing so.  To keep things simple, for the purpose of this post, I’ll focus on one of these schemes i.e. HDFC Equity Opportunities Fund II 1100D June 2017 (1).  It is due to be rolled over on 21 July.  

As the name would suggest, this was launched as a ~3 year scheme.  At the time of the launch, it was pitched as “an equity scheme with portfolio hedge”.  The fund manager sought to buy put options that would minimize the downside risk.  From what I have gathered, investors were tacitly led to believe that the put options were like a safety net and that the downside risk was realistically, very limited.  Three years on, as on 15 July, the NAV of the direct plan was down by ~14% while that of the regular plan was down by ~17%.  In contrast, the Nifty 500 index was up by  ~4%. 

Part of this difference is because the put options that were bought (~6% of the initial AUM),  expired without value.  However, if we ignore the impact of buying the put options, the NAV of the direct plan is still relatively down by ~9%.  Clearly, the fund manager did not add any alpha over these ~3 years.

In the letter sent to the investors, these are some of the reasons given to explain the underperformance:

Market returns for a major part of the tenure of the Scheme were characterized by narrow set of stocks outperforming. This impacted the returns of broadbased portfolios, including this Scheme.

The performance of large caps and mid/small caps diverged sharply over the past 2 years… The Scheme being a multi cap Scheme, invested in stocks across market capitalization and thus its returns were also impacted due to this sharp divergence.

While I agree with the market-related observations, I can’t agree with the scheme-related conclusions.  A fund manager of a multi-cap scheme has the flexibility to invest wherever he/ she wants to.  Moreover, these reasons do not explain the underperformance to the Nifty 500, which is a broad-based index. 

I recognize that active equity fund management is a difficult business and to be successful, being good is not enough- you need to be lucky as well.  For that reason, I don’t relish the idea of pulling down the fund manager for the absence of alpha.  However, I find it hard to sympathize with equity fund managers who make their lives even more difficult by choosing to manage closed-end schemes, more so a scheme with a 3 year maturity.  Managing such a scheme, if not a fool’s errand, is pretty close to being one.

And how is the rollover any different from locking oneself into another closed-end equity scheme?  It begs the question: what is the fund manager hoping to accomplish in the next 18 months that he couldn’t achieve in the last 3 years or so? 

But most of all, what of the investors?  Wouldn’t they be better off by switching to an open-end scheme?

Closed-end equity schemes are an inherently investor-unfriendly product that have typically been sold by incentivizing advisors to apply their persuasive skills on gullible investors.  Indeed, in the seedy underbelly of the fund industry, closed-end equity funds have occupied a particularly odious cranny.  Should it be a surprise then that HDFC MF has offered an additional incentive (over and above existing trail commission) to distributors who successfully roll over their clients? 

Thankfully, it appears that very few investors have opted for the rollover so far.  I say this based upon the diminished current AUM of the scheme that has already been rolled over.  I hope the same happens in the scheme yet to be rolled over.  Better still, I hope the rollover doesn’t happen.

In all fairness, in the last 18 months, no fund house has launched any closed-end equity scheme.  It might be that the industry is turning a new leaf, though I doubt it.  It might be the after-effects of SEBI’s decision, less than 2 years ago, to slash the maximum expense ratio that could be charged to any scheme which in turn, capped the payouts to distributors, notably in closed-end schemes.  Regardless, I fear that more fund houses may follow in the footsteps of HDFC MF and decide to roll over their schemes.

Note:  When these schemes from HDFC MF were launched, they were benchmarked against the Nifty 500 index.  For reasons that are not clear, shortly after the launch, the benchmark was changed to the Nifty 50 index.  For the purpose of performance comparison, it makes more sense to take the Nifty 500.  For one, the investment objectives of the schemes state that they are multi-cap fundsSecondly, as the fund house itself states, the growth in the Nifty 50 does not reflect the growth in the broad market.  I might also point out, that comparing with the Nifty 50 will paint a poorer picture of their performance.

October 10, 2019

Observations On The Essel Mess

Guest post by Norman Evan

Remember the 30 September deadline for some FMPs and other debt funds to have got back the money they’d invested in Essel group companies?  That date has come and gone, and things haven’t played out the way some mutual fund managers thought, or led investors to believe.

If you don’t remember or haven’t been following the story, it involved limited purpose, private companies linked to the Zee promoters.  Sprit Textiles, renamed as Sprit Infrapower and Multiventures.  Edisons Utility Works, renamed as Edisons Infrapower and Multiventures.  Continental Drug Company, renamed as Konti Infrapower and Multiventures.  There are more, but you get the idea.  If you lifted their corporate masks (or veils, if you like), I guess all these companies would look pretty much the same.

These companies had borrowed money from various mutual funds.  The borrowing was on largely similar terms. Most of the NCDs that were created, ticked all the boxes that would unnerve a risk-averse bond investor.  Zero coupon bond.  Check.  Backed by shares.  Check.  Rating by Brickworks.  Check.

As we’ve seen time and again, the mutual fund managers were either suckers for a good yield or had their own interests or agenda.  These NCDs had no place in mutual fund portfolios.  Certainly not in FMP portfolios where a lot of them landed.

Then, some months ago, there were the first signs of dark clouds looming.  It looked like the Zee promoters wouldn’t be able to pay back some of the money on time.  But if everyone went about selling the shares which backed the NCDs, they’d  get much less than what they hoped for.  So they all sat down and hatched up a plan.  They decided to give the Zee promoters time till 30 September to come up with the money.

So what happened?

One, not all companies paid up.  Why?  I guess only the Zee promoters or their associates can tell us that.  Konti paid back in full.  Edisons and Sprit paid back some of the money but there’s a fair bit still left to be paid back.

Two, the repayment has been pretty arbitrary. Kotak MF got paid back all that they were owed.  But Birla MF and HDFC MF have a lot less to smile about.  And while Kotak MF might brag about how their decision to give time to the Zee promoters has been vindicated, I’d say they got lucky.  Unless they arm twisted their way to get the payment. 

Talking about arbitrary repayments, this is becoming quite the thing.  Back in June, FT got fast track payments for their investments with the DHFL promoters.  Other mutual fund managers whose DHFL investments were more investment-worthy and repayment-worthy than that of FT, have been left holding a lemon. 

Three, there’s the mystery of dual ratings.  Brickworks, in its infinite wisdom, has downgraded some Sprit and Edisons NCDs to a D rating while it has downgraded other NCDs from the same companies to BB-.  Why?  It would seem that wherever payment was due, but didn’t happen, they did a downgrade to D.  But where payment was not yet due, they decided that those NCDs weren’t yet ripe for a complete downgrade.  Is this what happened with IL&FS or DHFL? No.  So why did this happen in this instance?  Read this rating rationale for the Sprit downgrade and see if you can figure that out.  I can’t.

To continue with Sprit as an example, it had NCDs outstanding to the extent of 1064 cr or so.  Of this, 211 cr was due as on September end.  The company paid back 100 cr- fine.  The 111 cr that it didn’t pay back was downgraded to D.  But the 853 cr which isn’t yet due, was only downgraded to BB-.  And that’s what makes my head explode.  Sort of.  These guys couldn’t pay back 111 cr but the rating agency seems more optimistic that they’ll pay back the 853 cr.  It just takes my breath away.

Could it be- could it just be- that this may have something to do with the impact it has on scheme NAVs?  A D downgrade would mean writing off 100% of the investment value while a BB- means writing off just 25% of the value.  You have to admit- AMCs do have a rather cozy relationship with rating agencies.

July 21, 2019

When Scheme Differences Are Erased

SEBI’s decision to create clearly defined scheme categories (and to limit fund houses to one scheme per category) was a big step towards empowering investors to make better scheme choices.  It’s been a year since that came into effect and for the most part, it’s been a success.  Unfortunately, some funds houses have found (or are finding) ways to wipe out the differences between schemes across different categories.  While there is a need for SEBI to step in, investors also need to be vigilant, else we could end up holding a scheme that is quite different from what we expected it to be. 

In this post, I want to share a few examples of the variety of ways in which fund houses have attempted to blur the differences between schemes in different categories.  I have presented these in the form of a short quiz.  There is a link to the answers at the end of the post.

Q1: Deceptive Descriptions

Given below are the descriptions of two open-end equity funds managed by a certain fund house.  These descriptions have been taken from the fund house website.  One of the schemes is classified as a ‘Mid Cap’ fund.  Based on these descriptions, can you identify which one of these is the real ‘Mid Cap’ fund?

Fund A:

An open ended equity scheme predominately investing in mid cap stocks

Fund B:

…is primarily a Mid-cap fund which gives investors the opportunity to participate in the growth story of today's relatively medium sized but emerging companies which have the potential to be well-established tomorrow.


Q2: Deceptive Advertising

Given below are masked banner ads for two equity schemes managed by a single fund house.  One of these schemes is classified as a ‘Focused’ fund, while the other is classified as a ‘Multi Cap’ fund.  If you had been able to read the detailed descriptions (which are in smaller print), you might have been able to know which ad is for which scheme.  But since these are website ads, which many will have seen (or will see) on mobile devices, the headlines become all the more important.  Based on the headlines, can you identify which of these is the actual ‘Focused’ fund?

Fund C:

Ad blacked out Fund 1

Fund D:

Ad blacked out Fund 2


Q3: Deceptive Allocations

Going by SEBI’s definition, in the so-called ‘Balanced Advantage’ funds, the equity/ debt allocation is required to be managed “dynamically”.  While some may consider that term to be all-encompassing, from what I have gathered, the purpose of having this category is to group those funds where the equity/ debt mix will be decided through a process of tactical asset allocation.  As it happens, at least one fund house either has an extraordinarily restrictive interpretation of what ‘dynamic’ means or has chosen not to make tactical calls.  The equity allocation of its ‘Balanced Advantage’ fund has remained in a remarkably narrow band and has had little resemblance to that of any other ‘Balanced Advantage’ fund.  But it has had more than a passing resemblance to the equity allocation of the ‘Aggressive Hybrid’ fund managed by the same fund house.  Given below is the unhedged equity allocation for the last 12 months for the two schemes.  Based on this information, can you identify which of these is the ‘Aggressive Hybrid’ fund and which is the ‘Balanced Advantage’ fund?

Equity Allocations


Q4: Deceptive Risk Profile

‘Credit Risk’ Funds are required to have at least 65% of their portfolio in securities that are rated AA or lower.  It is generally expected that these funds will carry a higher credit risk than any other class of debt funds.  Given below is the latest rating profile, yield, and maturity of the portfolios of three debt funds, managed by a single fund house.  Based on this information, can you identify which of these is the ‘Credit Risk’ fund?

Fund GFund HFund I
Portfolio Composition by Rating
  Sovereign/ AAA/ Cash16%15%12%
  AA+9%9%11%
  AA and lower75%76%77%
Average Maturity (years)3.13.42.9
Portfolio Yield11.7%11.4%11.7%


If you’d like to see the answers, click here.

April 14, 2019

Thoughts On The FMP Fiasco

This is only my second post in the last nine months, and while I’d like to believe that there hasn’t been much to write about all this while, the truth is that ongoing priorities have kept me away, not just from writing, but from closely tracking the fund industry as well.  Still, thanks to the evolving FMP crisis (which I couldn’t ignore) and the incessant cajoling of my collaborators, for whatever it is worth, here it is. 

Anyone who has been following the coverage of the crisis in the media (mainstream and social), would have noted that much of the attention has been on Kotak MF, and on the so-called “safety” of FMPs.  In this post, I’d like to move that spotlight a bit.  The way I see it, firstly, the risks in investing in FMPs are, more or less, the same as they have been over the last several years.  It’s just that many investors, advisors, and fund houses, have been in denial over the fact that portfolio concentration is a bigger risk than credit quality in itself.  While I’ve talked at length about this previously, in this post, I want to talk about the questionable choices made by fund houses this time around, once this risk became a likely reality.  Secondly, I feel that looking at the FMP fiasco from the lens of the decisions of HDFC MF (rather than Kotak MF) offers a better picture of what has happened.  Investors in Kotak FMPs may have been the first to be visibly impacted, but it was HDFC MF that was the first to make the choices that brought us to where we are.

Let me start by flipping back to a month ago.  By my count, there were 6 NCDs issued by three Essel group companies that were due to mature in March.   HDFC MF had investments in two of these companies (across 5 NCDs).  Most of these investments were held in FMP portfolios.  These are the details of those NCDs:

Name of company ISIN Date of Maturity
Edisons Utility Works Pvt. Ltd.^INE097P0704722 March 2019
INE097P0706222 March 2019
INE097P0709620 March 2019
Sprit Textiles Pvt. Ltd.#INE069R0709122 March 2019
INE069R0710920 March 2019

^ Since renamed as Edisons Infrapower & Multiventures Pvt. Ltd.
# Since renamed as Sprit Infrapower & Multiventures Pvt. Ltd.
NCDs whose ISIN is shaded are zero coupon bonds


As you will note from the table, all of these NCDs were slated to mature between 20-22 March 2019.  The reason I mention this is because, in the portfolio disclosure made by HDFC MF, all of these investments were shown to be held in the portfolios of its schemes as on 31 March 2019, more than a week after they were supposed to have matured.  It begs the question- what happened?  If the fund house got back its money on the date of maturity, then why were these investments shown in the scheme books as on 31 March?  And if the fund house didn’t get back its money, shouldn’t these investments have been written off? 

When I first saw the portfolios, I couldn’t figure out what exactly had happened.  Since then, it has come to light that the maturity date of these investments was “revised” to 30 September 2019.  But how did something like that come about?  Surely, an issuer can’t unilaterally revise the date of maturity.  Was this the outcome of the much talked about agreement between the lenders and the Essel group back in January? 

Regardless, in my opinion, there can be no excuse for treating non-payment on the original due date as anything but a default.  What I find especially remarkable is that three of the NCDs above were zero coupon bonds and accounted for over 61% of the value of these NCDs.  To put it differently, these are investments on which the fund house would not have received a single rupee of interest or principal over the last 3 years or so. 

It appears that Kotak MF took a similar stance as HDFC MF in respect of the NCDs it held (which matured on 8 April).  In its case, it appears that all the NCDs that matured were zero coupon bonds.  Personally, I believe that all these investments should have been written off completely.

But coming back to the revision of maturity date, there are two other aspects about this that bother me.  The first relates to investment norms for FMPs.  As per SEBI regulations, a FMP can invest only into securities which mature before the date of maturity of the scheme.  Of the 8 HDFC FMPs that held the aforesaid NCDs, one is maturing on 30 September (i.e. on the revised maturity date).  All the other FMPs (including one that has been decided to be rolled over) were/ are maturing not later than 1 July 2019.  Going by that, revising the maturity date would appear to be in violation of the SEBI MF regulations.

The second issue that bothers me is the role of the rating agency.  In December, last year, the rating agency had put the abovementioned companies/ NCDs on “credit rating watch”.  On 31 January, soon after the debacle related to the sale of shares of ZEEL, the rating agency put out a note, stating that the rating remained unchanged.  What puzzled me about that note was that the rating agency seemed to base its view more on the stated intent of the lenders and the borrowers, than anything else.  Importantly, there was no mention of any change in the date of maturity of the NCDs.

Then on 18 February, it downgraded the ratings by one notch to A, while maintaining the “credit rating watch”.  But there was still no mention of the maturity of the NCDs being revised.  Its next communication was only on 10 April i.e. three weeks after the original maturity date of these NCDs had passed.  It was here that it noted the revised maturity date of the NCDs.  From what I could gather, and strangely to me, the rating agency didn’t seem to see this as an issue of any significance.  Personally, I think there was a good case for the rating to be downgraded to D.

Looking at this all together, throws up a number of questions.  Why did the fund houses not mark down these investments?   Was it a coincidence that both Kotak MF and HDFC MF decided the same course of action?  Was it a coincidence that the rating agency took a similar view?  Or that the rating agency put out its note only after the NCDs held by Kotak MF had matured? 

One industry insider, whom I spoke to, offered this explanation for the action of the fund houses: “It’s all about the NAV.  They can’t risk showing a low NAV.”  That may well be, and there may be other reasons as well.  One thing appears certain to me: both these fund houses (and perhaps others as well) appear to be desperate to project an illusion of safety around FMPs.  What is worse is that these fund houses are attempting to manipulate investors by playing on their behavioural biases. 

Take for instance, the decision by HDFC MF to roll over one of its FMPs.  Like some others, I hold the view that the officially stated purpose behind doing so, is a preposterous and sanctimonious assertion meant to camouflage the fact that the scheme has ~20% of its portfolio in Essel group companies.  But in terms of their relationship with investors, the roll over strikes me as a way to delude the investors into believing that they never risked losing money. 

Similarly, I noted a very careful choice of words by one of the spokespersons of Kotak MF, which also struck me as intended to delude investors.  To paraphrase the comment: “The impact is primarily on the returns, not on principal”.  To which I am tempted to retort: “Have you ever heard of time value of money?”  Even more bizarre was another statement by that person: “I tend to disagree that it is a call gone wrong”.

For anyone still wondering about what the fund houses were thinking, I present this (hopefully accurate) observation from the latest HDFC MF and Kotak MF portfolio disclosures.  While most of the NCDs of Essel group companies were held in FMP portfolios, there were only two open-end debt funds that also held these NCDs.  These were HDFC Credit Risk Debt Fund and Kotak Credit Risk Fund.  Need I say anything more?

July 09, 2018

Baffling Trades In ICICI Securities

Why would a fund manager buy shares of ICICI Securities in the IPO and then sell them off at a loss, two months later? 

As many of us would know, since its IPO in March, the stock price of ICICI securities has seen a sustained fall.  At no point, thus far, has the price come back to its IPO price of 520.  If I take the month of May in particular, the price ranged between a high of 421 and a low of 352.  Yet in that same month, fund managers across 10 9 schemes that acquired the stock in the IPO, brought down those holdings or exited them completely.  All put together, these fund managers sold off shares worth 96 91 crore at the time of the IPO, at a loss of somewhere between 19% to 32%.

The table below lists the schemes that took this hit.

Schemes that sold shares of ICICI Securities in May 2018

No of shares
bought in IPO

Price: 520
No of shares
sold in May
 
Price: 352-421
HDFC TaxSaver981,120508,500
Axis Long Term Equity Fund480,788480,788
Reliance Growth Fund288,456288,456
Reliance Banking Fund192,304192,304
Edelweiss Maiden Opportunities Fund-196,18096,180
UTI Multi Cap Fund96,15296,152
Edelweiss Long Term Equity Fund96,15286,183
Kotak Bluechip Fund63,44863,448
Kotak Equity Savings Fund30,74430,744
UTI Banking and Financial Services Fund288,4843,957

Data Sources: BSE, NSE, RupeeVest.


The way I see it, a couple of months is just too short a period for a long term investor to have drastically changed one’s view on this stock.  So what else could explain the actions of these fund managers? 

One view is that the fund managers may have been forced to do this on account of scheme reclassification.  That doesn’t make sense to me because the stock fitted comfortably into the portfolios of all of the schemes on the list above.  Another view is that this might have been done to meet redemptions.  But the extent to which most of these fund managers reduced their positions makes me doubt that.  As it happens, one of the schemes on the list is a closed-end scheme while three others are ELSS.  A third view is that the fund managers may have decided to cut their losses.  While that’s not implausible, it strikes me as an approach that a trader would take and not something that a fund manager would do. 

As I took a closer look at the numbers, something else emerged.  This pertains to three two fund houses whose schemes are listed above: Kotak Mahindra MF, Reliance MF and  UTI MF.  It turns out that in the same month, while their schemes listed above reduced or exited their holdings, there were other schemes managed by these fund houses where the exposure to ICICI Securities was increased.  In the case of the latter two fund houses, the shares sold in one scheme were identical to the shares bought in another scheme, suggesting the possibility that these might be inter-scheme transfers.

Fund houses that took contradictory action on ICICI Securities in May 2018

Action taken
No of shares
Kotak Mahindra MF
Kotak Bluechip FundSale63,448
Kotak Equity Savings FundSale30,744
Kotak Emerging Equity SchemePurchase154,828
Reliance MF
Reliance Growth FundSale288,456
Reliance Banking FundSale192,304
Reliance Focused Equity FundPurchase192,304
UTI MF
UTI Banking and Financial Services FundSale3,957
UTI Multi Cap FundSale96,152
UTI Value Opportunities FundPurchase96,152

Data Source: RupeeVest.


Frankly, I can’t think of any good reason why a fund house would have sold its loss-making investments in one scheme only to buy those shares in another scheme. 

In fact, looking at all of this, makes me question the credentials of the concerned fund houses and fund managers to manage long-term investments.  I came upon all of this information, quite by accident.  But now I wonder that beyond ICICI Securities, where else may something like this have happened, and how often it might have happened.  I guess that unless these fund houses/ fund managers decide to open up about this, we may not know.  Personally, I think that investors in these schemes should press hard for answers.

Correction: The original version of the post incorrectly identified UTI Multi Cap as a fund that had sold shares of ICICI Securities.  That scheme was merged into UTI Value Opportunities Fund.  I apologize for the inaccuracy.

June 12, 2018

Scheme Mergers Can Be Costlier Than You Think

As part of the scheme rationalization exercise directed by SEBI, HDFC MF merged its Balanced Fund with its Premier Multi-Cap Fund w.e.f. close of business hours on 1 June.  To put it more accurately, Premier Multi-Cap Fund, an equity fund, was first transformed into a hybrid fund and was renamed as HDFC Hybrid Equity Fund.  Then, on the same date, Balanced Fund was merged into that fund.  It was a complex manoeuvre that confounded many industry insiders and observers, including me.  

For one, at its heart, this was a merger of a hybrid fund with a pure equity fund.  Mergers between dissimilar funds are fraught with a variety of issues and are hard to justify.  Secondly, if, for some reason, such a merger was warranted, then the most practical and straightforward approach would have been to merge Premier Multi-Cap Fund into Balanced Fund (and not the other way round).  After all, the new scheme was more similar to Balanced Fund than to Premier Multi-Cap Fund.  Also, at the time of the announcement, Premier Multi-Cap Fund had AUM of ~300 crore while Balanced Fund had AUM of ~22,000 crore.  It would have made more sense for the smaller scheme to be merged with the bigger scheme than vice versa. 

Like many others, I decided to write it off as a mystery.  Then, last Friday, an investor in the direct plan of Hybrid Equity Fund reached out to me on this.  He had been an investor in Balanced Fund before the merger, and there was something that bothered him.  From what he could make out, after the merger, the expense ratio of his investments had significantly gone up.  He sought my view on whether this was actually the case.

It turned out that his observation was spot on.  Here are the facts:

  • On 1 June, the date of the merger, the total expense ratio (TER) of Balanced Fund (direct plan) was 0.56% while the TER of Premier Multi-Cap (direct plan) was 2.16%.   Post-merger, the TER of the direct plan of the merged fund (HDFC Hybrid Equity Fund) was 2.16%.
  • On 4 June, the TER of the direct plan of Hybrid Equity Fund was reduced  to 1.43%.  This continued till 7 June. 
  • From 8 June, the TER was reduced to 0.66%.

As would be evident from the above, even after the “reductions”, post-merger, investors in the direct plan of Balanced Fund (who opted for the merger) have been paying more than what they were paying earlier.

There is one other thing worth pointing out over here regarding the reductions.  It would seem that 0.15% of the reduction was on account of a change directed by SEBI to all fund houses.  In other words, if the merger had not happened, it was likely that, thanks to SEBI, the expense ratio of Balanced Fund would have been brought down to 0.41%.  If so, that makes the difference with the post-merger TERs even more glaring.

If my numbers are correct, in the 11 days since the merger, the investors in the direct plan of Balanced Fund (who opted for the merger) have been collectively charged (excluding GST) an additional ~67 lakhs (i.e. over and above what they would have been charged, had the merger not happened).  At present, by my estimate, they are being collectively charged (excluding GST) an additional ~2.3 lakhs per day (unless, of course, the fund house reduces the expense ratio further).

Something similar to this (though not to the same extent) happened to investors in the direct plan of HDFC Prudence Fund .  Like Balanced Fund, this, too, was questionably merged into an equity fund (HDFC Growth Fund) whose attributes were changed to make it a hybrid fund – HDFC Balanced Advantage Fund. 

All of this raises the question: did HDFC AMC act in an unfair manner with the investors in Balanced Fund and Prudence Fund, particularly those in the direct plans? 

Certainly, there are grounds to believe so.  Consider this: pre-merger, the AUM of Balanced Fund (direct plan) was ~3,500 crore while the AUM of Premier Multi-Cap (direct plan) was merely ~18 crore.  If their pre-merger expense ratios were to have been applied proportionate to their AUM, then the post-merger expense ratio should have right away been fixed at 0.57% (instead of 2.16%).

Of course, it can be argued that the merger letter to investors mentioned the then expense ratios of both schemes, so any investor who felt that he/ she was being treated unfairly, could have exited.  On the other hand, it can also be argued there was no mention of the possible increase in expense ratios in the key paragraph on “Consequences of Merger of Schemes” in the merger letter. 

It might be a good idea for SEBI to examine if something can be done to ensure that investors are treated fairly in mergers.

For now, this should serve as a cautionary tale for investors.

April 03, 2018

How Fund Houses Are Trying To Sabotage SEBI’s Expense Ratio Reforms

Seeing the things that some fund houses do, frequently gives me the feeling of watching cheap crooks in action.  The type that get a thrill from travelling without a ticket.  The type that like to steal from the weak and elderly.  The type that give a stupid grin when caught with their hands in the cookie jar.  Except that there’s nothing cheap about the scale on which fund houses operate.

It’s been a month since SEBI’s disclosure norms for expense ratios came into effect.  They were among the most significant set of reforms undertaken by SEBI in recent times.  They were intended to boost transparency, and bring down costs.  Yet the fact is that some fund houses have lacked the ability to appreciate the spirit of those moves, while others have plain ignored it. Worse still, some fund houses have shown no respect for investors or for SEBI and have, in effect, mocked the process of reforms (see here, for example).  In this post, I want to give a sense of how widespread this is.  I will talk specifically on one key issue i.e. the expense ratio files that fund houses have put up on their websites.  I hope to spotlight the questionable approach of multiple fund houses, and the message that they appear to be giving to their investors. It is based on what I have seen across the websites of select fund houses: it is not an exhaustive analysis. 

“Don’t visit our website!”
On many fund house websites, locating the expense ratio file can be a tall order.  It might be under disclosures, or under downloads, or somewhere else.  Probably no fund house has made it tougher to locate the file than Kotak Mahindra MF.  Leave aside the fact that its website is a sprawling mess, or that it does not seem to have even the option for a search.  When I tried looking for the file, I just couldn’t find the link.  It wasn’t even on the sitemap.  Finally, I had to do a search on Google to get to the file.  Just so that you know, when it comes to other fund houses, doing a search on Google isn’t going to necessarily help.

“We’re going to make it really difficult for you!”
What if you want to compare expense ratios across all schemes of a fund house?  Many fund houses have presented their data in such a manner that it is not easy to do so.  Some, such as IDFC MF and Kotak Mahindra MF have given the data for each scheme in a separate sheet, making it a gruelling task to do such comparisons.  Others like  ICICI Prudential MF and SBI MF have made the task even more laborious because they have opted to have separate files for each scheme.  Thus, instead of a single download, they expect you to make multiple downloads, each time you want to see the data.  And given the number of schemes that they have, that, by itself, could take a really long time. 

“We’re going to make it really, really difficult for you, and we don’t care what SEBI thinks!”
Getting expense ratio information from the HDFC MF website poses a different level of difficulty.   The fund house first wants you to decide whether you want current data or historical data.  If it is historical data, then you are expected to put in a date range.  Thereafter, just like ICICI Prudential MF and SBI MF, you have to download the data for each scheme separately.  Last, but not the least, the information in the files is presented in a format that is different from what SEBI has stipulated.  As a result, if you simply want to compare expenses across direct and regular plans of a single scheme, doing so is an uphill task.

“We’re going to drive you nuts, and SEBI can’t do a thing about it!”
In what I would describe as a drastic departure from SEBI’s format, DSP BlackRock MF and IDBI MF (and possibly others) have opted to give the expense ratios for each date in a separate file.  Consequently, if you want to examine the date-wise expense ratios in any single scheme, be prepared for a nightmarish experience.  In the case of IDBI MF, if you want to compare expense ratios across schemes on any single date, that task will also prove to be arduous because the information for each scheme is in a separate sheet.  In my opinion, of all the fund houses, the approach taken by IDBI MF is either the most harebrained or the most sadistic.

“We’re the most investor-friendly!”
I have to admit that, going into this exercise, I did not expect UTI MF to emerge as the best example of a fund house conforming to SEBI’s disclosure.  Fact is, it was a delight to see what the fund house has done: I just hope that they keep it up.  All you need to do is to select a date range.  You can then download the daily expense ratios across all schemes, exactly the way SEBI has specified, and all in a single sheet.  What’s more, the scheme names are entered in such a way that using the feature of filters in Excel, you can easily make comparisons across schemes.  I am not sure if what they have done can be improved but as things stand, every fund house should at least follow their lead.

January 10, 2018

10 Years After The 2008 Peak

On Jan 8 2008, the BSE Sensex closed at a then all-time high level of 20,873.  This week, as it hit new all-time highs, I have been poring through performance numbers of equity funds over these last 10 years.  In this post, I’d like to share some of my observations and thoughts.

Is this what we expected?
“How much return would you expect the Sensex to give over a 10 year period?”  Back in the day, I would pose this question to advisors and investors, as part of a long-running series of exercises that I conducted.  Throughout 2007-08, the most common answer I got was “at least 15% p.a.”.  It was an understandable response.  The growth in the Sensex from its base date in 1979 to its value at the end of December 2007, stood at just over 20% p.a. (without reinvesting dividends).  Some would consider the estimate of 15% p.a. to be too high.  The most conservative estimates that I heard were of a growth of no less than 10% p.a.  Yet, the fact is that over the last 10 years, the BSE Sensex TRI grew by just 6.6% p.a.  The BSE MidCap TRI did a bit better, growing by 7.9% p.a.  And for whatever you may find it worth, the BSE SmallCap TRI grew by just 5.3% p.a.  All these numbers pale in comparison to the fact that a 10 year deposit with SBI over the same period would have given an assured compounded annualized rate of 8.78%.

So, going forward, could such long-term underperformance by equity indices be a more frequent occurrence, or is this just a blip?  When I discussed these numbers with a prominent industry observer, he responded with a quote that is frequently attributed to Keynes: “Markets can remain irrational far longer than we can remain solvent.”

How much value did actively managed funds really add?
Of the 140 actively managed, domestic, diversified equity funds that survived these 10 years, only 2 schemes gave an annualized return in excess of 15% p.a.  While the median return of this group was 9.2% p.a., 61 schemes (i.e. 44% of all schemes) gave less returns than the SBI deposit would have.  Of these, 28 schemes (20%) gave less returns than the BSE Sensex.  All these numbers exclude entry loads, which were prevalent at the time.

How did the largest schemes perform?
The table below gives the list of the largest equity funds (by AUM) at the end of December 2007 along with their returns over these 10 years.  Some of the names on this list may surprise those who weren’t investors at the time.  I can’t say how many investors were committed to being invested in these schemes for 10 years or more.  For those who were, it is a moot question as to whether their faith in these schemes was justified.  For better context, I have also given the ranking of these schemes based on their return.

AUM Rank
Dec 2007
Return p.a.
2008-2018
Return Rank
2008-2018
Reliance Growth Fund19.9%72
Reliance Diversified Power Sector Fund24.1%181
HDFC Equity Fund311.4%37
ICICI Prudential Infrastructure Fund44.8%173
DSP BlackRock India T.I.G.E.R. Fund55.6%155
Reliance Vision Fund67.8%116
Fidelity Equity Fund*710.2%65
Franklin India Flexi Cap Fund810.2%66
SBI Magnum Taxgain Scheme98.2%105
Reliance Focused Large Cap Fund105.6%156

Returns are for the period 8 Jan 2008 to 8 Jan 2018 and exclude loads.  AUM and Return ranking is among all open-end equity funds that survived these 10 years.  Total no of funds: 202.
* This scheme has seen a change in fund house management from 2008 to 2018.
Data/ Information sources: AMFI, NJ India Invest, Value Research

How many of us could predict the top performers?
The table below gives the list of domestic, diversified equity funds which gave the highest return over these 10 years.  Alongside I have given their ranking among equity schemes based on their current AUM, as well as their AUM ten years ago.  Going by their AUM ranking ten years ago, it would seem that most investors weren’t betting big on most of these schemes.

Return p.a.
2008-2018
AUM Rank
Dec 2007
AUM Rank
Current
HDFC Mid-Cap Opportunities Fund16.5%364
DSP BlackRock Micro Cap Fund16.0%10826
ICICI Prudential Value Discovery Fund14.7%975
Canara Robeco Emerging Equities Fund14.5%25759
Franklin India Smaller Companies Fund14.2%4923
Sundaram Select Midcap Fund14.0%1929
DSP BlackRock Small and Mid Cap Fund13.8%4435
IDFC Premier Equity Fund*13.6%7730
UTI Mid Cap Fund13.5%11444
L&T Midcap Fund*13.4%23986

Returns are for the period 8 Jan 2008 to 8 Jan 2018 and exclude loads.  AUM ranking is among all open-end equity funds.  Current AUM ranking is based on AUM  at end of Nov 2017 which is the latest date for which data was available across all fund houses.  Total no of funds- Dec 2007: 287; Current: 385. 
* These schemes have seen a change in fund house management from 2008 to 2018.
Data/ Information sources: AMFI, NJ India Invest, Value Research

How important is the long-term performance of a scheme to investors?
This is the question that bothers me the most.  It is widely recognized that a scheme’s long-term, multi-cycle performance is a good indicator of a fund management team’s competence.  However, if the current AUM of equity schemes is anything to go by, it would seem that long-term performance of a scheme doesn’t really matter to many investors.  As evidence, consider this: three of the ten largest actively managed, diversified equity funds today, did not exist 10 years ago.  These three schemes currently have a combined AUM of ~47,000 crore.  In other words, investors have poured significant money into schemes that were not tested in the brutal bear phase of 2008-09.  I find it all the more astonishing given that two of the fund houses behind those schemes had a patchy record with their other schemes during 2008-09 while the third fund house itself did not exist at the time (nor did its sponsor have any known track record of fund management). 

That’s not all.  There is one more statistic that quantifies the lack of consideration for long-term performance.  It is that the actively managed, domestic diversified schemes that actually underperformed the BSE Sensex over the past 10 years currently have a combined AUM of ~19,000 crore.  If you include thematic/ sector funds, that number goes up to ~32,000 crore.

Warren Buffett famously stated that risk comes from not knowing what you are doing.  While past underperformance (or absence of performance) is no guarantee of future underperformance, I hope investors in all these schemes know what they are doing.

December 25, 2017

In The World Of ‘Yo-Yo Funds’

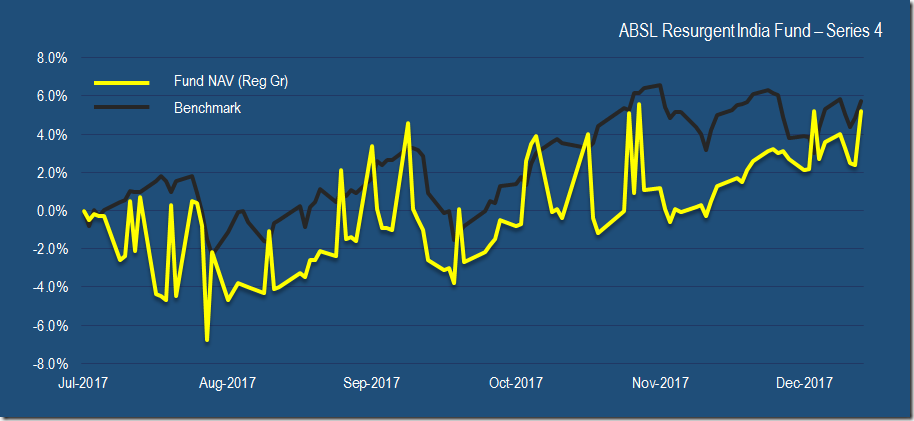
On the fringes of the more volatile mutual fund schemes, there lie a set of schemes that I am tempted to describe as ‘yo-yo funds’.  Why?  Because of the way that their NAVs swing up and down, like a yo-yo.  All too often, their NAVs rise sharply one day, and then fall sharply the next day, or vice versa.  Thus far, all such schemes that I have seen are closed-end equity/ hybrid schemes, and a  key common link to their NAV fluctuations is their exposure to long-term derivatives contracts.  In this post, I propose to shine a bit of light on these schemes.  In doing so, there are three things that I hope to accomplish.

The first is to create awareness about the existence of ‘yo-yo funds’.  In conversations that I have had with advisors and investors, most of the people that I spoke to, could not believe that the NAV of any mutual fund scheme could fluctuate in such a way.  The second is to caution those considering investing in closed-end equity and hybrid schemes that are likely to have exposure to long-term derivatives contracts.   Such NAV fluctuations are something that they could well encounter, and they should be willing to accept that.  The third is to reinforce the point on volatility which was the heart of my last post.  I believe that fund houses need to be more sensitive to the impact that volatility can have on investors, even in closed-end schemes.

To keep things simple, I’ll focus on two such schemes. I’ll present some numbers on their NAV fluctuations, as also the visual evidence of charts.  Both are 3-4 year closed-end equity schemes, but with different benchmarks, and managed by different fund houses.  Both schemes were launched in July 2017.  To be clear, my choice of these schemes is not related to what I feel about their fund houses.  These are good examples that can help in reflecting upon the problematic existence of ‘yo-yo funds’.

HDFC Equity Opportunities Fund-II-1100D June 2017

Benchmark: Nifty 50
Launch Date: 12 July 2017
Maturity Date: 20 July 2020

The chart below shows the NAV movements of the scheme since its inception.  It also gives a sense of the frequent swings that made me regard this as a ‘yo-yo fund’.  It may be instructive to compare those swings with the movement in the value of the benchmark at those times.

HDFC EOF II 1100D June 2017 NAV

The table below summarizes the extent of daily fluctuations in the NAV of the scheme, relative to its benchmark index. 

Fund Benchmark
Max rise on a single day 4.2% 1.2%
Max fall on a single day -4.3% -1.6%
Standard Deviation (daily returns) 36.5% 11.8%
% of days on which swing in excess of +/- 3% 23% Nil
% of days on which swing in excess of +/- 4% 5%
Nil

Data period: 17 July 2017 to 15 Dec 2017
Data/ information sources: HDFC MF, NJ India Invest, NSE, Value Research


ABSL Resurgent India Fund – Series 4

Benchmark: S&P BSE 200
Launch Date: 7 July 2017
Maturity Date: 6 June 2021

As with the previous scheme, the chart below shows the NAV movements of this scheme since its inception.  You may notice that the NAV swings in the case of this scheme (relative to the previous scheme) are much more pronounced.  This is also borne out by the data in the table below the chart.

ABSL Resurgent India Fund - Series 4 NAV

Fund Benchmark
Max rise on a single day 5.7% 1.3%
Max fall on a single day -6.0% -1.9%
Standard Deviation (daily returns) 44.5% 12.6%
% of days on which swing in excess of +/- 3% 23% Nil
% of days on which swing in excess of +/- 4% 16%
Nil

Data period: 17 July 2017 to 15 Dec 2017
Data/ Information sources: ABSL MF, Asia Index, Value Research

Both these schemes hold Nifty put options, evidently for the purpose of hedging.  There are some who argue that such hedging is necessary to protect investors in the schemes, and that the volatility should be seen in that context.  There are others who suggest that the volatility is mostly on account of the lack of depth in the derivatives market, and that it is unfair to blame fund houses for that.  To me, though, these arguments overlook/ bypass a more fundamental question: what is the compulsion to launch closed-end equity schemes, particularly those with maturities of 3-4 years?

September 24, 2017

Excessively Expensive Income Funds

For some time now, I have been trying to maintain a watch list of the most expensive plans among income funds.  While expenses matter regardless of fund category, in the case of income funds they have a more consistent and harder impact (than, say, in the case of equity or balanced funds). Much more often than not, higher expenses lead to low returns or higher risk or both. 

While pursuing this objective, one of my most striking observations has been that the plans that I consider to be excessively expensive, account for a large chunk of the AUM in the category.  If I go by last quarter’s AAUM data, then 69% of the money invested in regular plans (i.e. other than direct) of income funds (other than liquid funds and pure debt fixed maturity plans) was allocated to plans that I consider to be excessively expensive.  This could mean one of two things: either my threshold for expensiveness is too low or most investors in regular plans have been sold plans that are way too expensive.  For those who want to explore the truth of the matter, in this post I present a small selection of the income funds on my list.  But before we get into the specifics, there are a few things to bear in mind. 

Firstly, evaluating and explaining a plan’s expensiveness can be a far more complex exercise than most people realize.  In presenting the data in this post, I have opted to keep things simple (some may regard it as an oversimplification).  I have limited the scope of my presentation to non-direct plans, and have primarily focussed on each plan’s expense ratio relative to that of peer group schemes. For the purpose, I have grouped schemes into five categories.  While I have tried to keep things as objective as possible, in any discussion on expensiveness, some degree of subjectivity/ personal bias is unavoidable.

Secondly, against each scheme that I have listed, I have given the current AUM of its non-direct plans.  This is intended to serve two purposes.  For one, it tells you how much money stands invested in these expensive plans.  Additionally, it can help you better understand a plan’s expensiveness.  As a rule of thumb, schemes with larger AUM are expected to have lower expense ratios than schemes with lesser AUM.  Similarly, schemes with larger AUM than most of their peer group should ideally have expense ratios that are below the category average. 

Thirdly, bear in mind that this is a small selection of schemes from my list.  My complete list of excessively expensive plans is too long and complex to be meaningfully presented here.  The plans presented below are not necessarily the most expensive ones: they are some of the most expensive ones.  They have been handpicked to show how widespread the problem of high expenses is.

Lastly, what you see below is not the ideal way that I would like to present this information.  I am compelled to do so because of the constraining ways in which fund houses report expense ratios and AUM data, and because many fund houses frequently change their expense ratios.


Ultra Short Term Schemes
Average Current Expense Ratio: ~0.75%

Expense Ratio
Regular Plan FY 17
Current AUM
Non-Direct
IDBI Ultra Short Term Fund 1.40% 410 cr
ICICI Prudential Savings Fund 1.38% 7,057 cr
SBI Savings Fund 1.36% 3,546 cr
DHFL Pramerica Low Duration Fund * 1.24% 686 cr
HDFC Cash Management Fund - Treasury Advantage Plan 1.13% 10,768 cr

With one exception, this category covers all schemes currently classified by Value Research as ‘Ultra Short Term’.  Data for expense ratios has been sourced from scheme annual reports, monthly factsheets and third party sources.  Data for AUM has been sourced from latest available AAUM disclosures and includes AUM for plans that have been suspended for fresh investments. Schemes whose expense ratios are shaded in yellow have above-average AUM in the category.

* One plan in which fresh sales have been suspended since 2012 but in which there continues to be AUM had an expense ratio of 2.51% in FY 17.


Short Term Schemes
Average Current Expense Ratio: ~0.94%

Expense Ratio
Regular Plan FY 17
Current AUM
Non-Direct
HDFC Regular Saving Fund *1.79%4,517 cr
Franklin India Short Term Income Plan1.57%7,000 cr
Sundaram Select Debt Short Term Asset Plan1.48%307 cr
Aditya Birla Sun Life Short Term Opportunities Fund1.40%4,605 cr
IDFC Super Saver Income Fund - Medium Term Plan1.31%2,057 cr
ICICI Prudential Short Term Fund1.24%6,329 cr

This category covers all schemes currently classified by Value Research as ‘Short Term’.  Data for expense ratios has been sourced from scheme annual reports, monthly factsheets and third party sources.  Data for AUM has been sourced from latest available AAUM disclosures and includes AUM for plans that have been suspended for fresh investments.  Schemes whose expense ratios are shaded in yellow have above-average AUM in the category.

* (1) The expense ratio of the regular plan of HDFC Regular Savings Fund saw one of the steepest jumps in the category from 1.07% in FY 16 to 1.79% in FY 17.  (2) The expense ratio of the direct plan in FY 17 was 1.19% which was higher than the expense ratios of the regular plans of most schemes in the category.


Medium Term/ Long Term/ Dynamic Schemes
Average Current Expense Ratio: ~1.43%

In my opinion, this category as a whole, is somewhat more expensively priced than it should be.  By my reckoning, if it were to have been fairly priced, then at this point in time, the average current expense ratio for this category should have been ~1.07% (disclaimer: based on complex calculations, subjective assumptions, and personal bias).

Expense Ratio
Regular Plan FY 17
Current AUM
Non-Direct
Sundaram Bond Saver 2.61%120 cr
Sundaram Income Plus *2.23%117 cr
Franklin India Income Builder Fund2.08%872 cr
Reliance  Income Fund2.00%499 cr
Aditya Birla Sun Life Corporate Bond Fund1.97%2,947 cr
HDFC Income Fund1.96%1,086 cr
HDFC Corporate Debt Opportunities Fund1.84%10,724 cr
Franklin India Corporate Bond Opportunities Fund1.83%6,237 cr

With one inclusion, this category covers all schemes currently classified by Value Research as ‘Credit Opportunities’, ‘Income’ and ‘Dynamic Bond’.  The inclusion is Sundaram Income Plus which is currently classified by Value Research and Morningstar as ‘Ultra Short Term’.  Since its stated benchmark is CRISIL Composite Bond Fund Index, I feel it appropriate to include it in the present category.  Data for expense ratios has been sourced from scheme annual reports, monthly factsheets and third party sources.  Data for AUM has been sourced from latest available AAUM disclosures and includes AUM for plans that have been suspended for fresh investments. Schemes whose expense ratios are shaded in yellow have above-average AUM in the category. 

* (1) Over the last 3 financial years, the expense ratio of the regular plan of Sundaram Income Plus has seen a remarkable level of fluctuation, changing from 2.17% in FY 15 to 0.38% in FY 16 to 2.23% in FY 17.  (2) The expense ratio of the direct plan of Sundaram Income Plus in FY 17 was 0.22%.  As far as I can make out, the difference between the expense ratios of the regular plan and the direct plan of the scheme was the highest for any pure-debt scheme.


MIP Schemes
Average Current Expense Ratio: ~2.15%

In my opinion, this category as a whole, is way too expensive.  Consider this: in the case of many fund houses, if you were to create an MIP-type allocation on your own by investing in their most expensive equity scheme, and their most expensive debt scheme, that would be cheaper than investing in their MIP schemes.  By my reckoning, if it were to have been fairly priced, then at this point in time, the average current expense ratio for this category should have been ~1.26% (previous disclaimer applies).

Expense Ratio
Regular Plan FY 17
Current AUM
Non-Direct
DSP BlackRock Monthly Income Plan2.60%447 cr
HDFC Monthly Income Plan - Short Term Plan2.60%322 cr
BNP Paribas Monthly Income Plan2.59%327 cr

This category covers open end income schemes that allow for marginal equity allocation, and which are targeted at investors seeking regular income.  Data for expense ratios has been sourced from scheme annual reports, monthly factsheets and third party sources.  Data for AUM has been sourced from latest available AAUM disclosures and includes AUM for plans that have been suspended for fresh investments.


Closed End Income Schemes With Marginal Equity 
Average Current Expense Ratio: ~2.31%

In my opinion, this is, by far, the most expensive category of income funds.  In terms of asset allocation and return potential, it is similar to the category of MIP schemes.  However, the essential running costs of these schemes are less (lesser servicing costs, lower portfolio turnover etc.).  As a result, there is a case to say that the average expense ratio in this category should be less than that of MIP schemes.  There is also a case to say that the expense ratios of many plans in this category reflect fund house-distributor collusion with the intent of milking investors, at its ugliest.  By my reckoning, if this category were to have been fairly priced, then at this point in time, the average current expense ratio should have been no more than 1.26% (previous disclaimer applies).

Average Expense Ratio
Regular Plans FY 17
Current AUM
Non-Direct
HDFC Capital Protection Oriented Fund - Series III2.69%322 cr
DHFL Pramerica Hybrid Fixed Term Fund (Multiple Series)2.65%634 cr
Sundaram Hybrid Fund (Multiple Series)2.65%520 cr
Axis Hybrid Fund (Multiple Series) *2.53%6,474 cr
ICICI Prudential Multiple Yield Fund (Multiple Series)2.51%1,364 cr
Kotak Capital Protection Oriented Scheme (Multiple Series) ^^2.44%426 cr
ICICI Prudential Capital Protection Oriented Fund (Multiple Series)2.34%3,277 cr

Data for expense ratios has been sourced from scheme annual reports and third party sources.  Data for AUM has been sourced from latest available AAUM disclosures.  While compiling the data, only plans that were in existence on the date of compilation i.e. 21 Sep 2017 have been considered.

* 93% of  the current AUM of Axis Hybrid Fund has come via associate distributors such as Axis Bank.

^^ As far as I can make out, Kotak Mahindra MF does not follow SEBI directions/ industry practices in reporting plan-wise expense ratios in its annual reports. The expense ratio number given here includes both direct and regular plans.  The actual expense ratio for regular plans alone can be assumed to be higher than what is mentioned.

⬅ Previous